Distribution Metrics for Dummies – The Science of Profitability


500 Global Team
PUBLISHED
2013.09.17
SHARE
TAGS
This post is part of the ongoing Distribution Tuesday series. Every week the 500 Distribution Team highlights actionable resources for marketing your startup. Get even more tips by following @500Distribution on Twitter and subscribing to our email newsletter.
Distribution hacking is a numbers game. The ultimate goal: acquiring new customers for less than the amount they’re worth as a customer. This means your CPA (cost per acquisition aka cost per conversion) needs to be lower than your LTV (lifetime value). There are many factors that go into the calculation of CPA and LTV. Understanding how these factors can impact CPA and LTV is critical to doing distribution hacking.

Internal vs. External Metrics
Distribution metrics can be broken down into two categories:
-
Internal: Measurements of actions on your website or app. An example would be conversion rate, which is the measurement of the number of users that land on your website or app compared to the number of users that actually convert.
-
External: Measurements of actions outside of your website or app. Depending on what advertising platform you’re using, external metrics could include CPC (cost per click), CTR (click through rate), and more.
Thinking back to the ultimate goal of distribution hacking, CPA and LTV are our key metrics. CPA is actually a formula that takes into account both internal and external metrics.
CPA is cost per acquisition – how much will it cost to acquire one new customer. A customer is defined as a user who has converted to whatever the conversion goal is for your business. This could be a new registration, newsletter opt-in, purchase, etc depending on what is valuable for your business.
Everything Relates
Here’s an example of how a prospect might go from viewing an advertisement to converting into a customer:

It’s important to note that during each step of this funnel, a change in performance (for example, increasing click through rate) will have a direct impact on your CPA. Let’s take a look at how all the metrics break down.

There are a couple ways to calculate CPA. The simplest version of CPA is:
CPA = Ad Spend / Conversions
Since there’s a lot of information missing from this formula, I like to think about CPA in terms of the cost of bringing someone to our website in relation to the conversion rate:
CPA = CPC (cost per click) / CR (conversion rate)
Thinking about CPA in this fashion gives us two distinct metrics we can work to improve. These metrics break down as follows:
CPC = Ad Spend / Ad Clicks
CR = Conversions / Landing page views
The full formula looks like:
CPA = (Ad Spend / Ad Clicks) / (Conversions / Landing Page Views)
The formula, this time using actual numbers:
CPA => ($100 in Ad Spend / 100 Ad Clicks) / (5 Conversions / 100 Landing Page Views) = $20 CPA
In this example, we spent $100 to get 100 clicks, meaning we have $1 CPC. We were able to convert 5 of the 100 people who came to our landing page, giving us a 5% conversion rate. Then we divided the $1 CPC by 5% CR, which left us with a $20 CPA.
Now that we have the basic numbers figured out we can improve our overall CPA by improving either our CPC or CR.
For example, if we were able to double our ad CTR by using more appealing images/copy – and double the amount of clicks we get for the same ad spend – we would cut our CPC and CPA in half (assuming the same conversion rate of 5%)! Let’s look how this works:
CPA => ($100 / 200) / (10 / 200) = $10 CPA
In the previous example we were able to cut our CPC from $1 to $0.50. By assuming the conversion rate stays the same, we were able to convert 5% of 200 clicks rather than 5% of 100 giving us 10 conversions for the same $100.
Let’s take this even further – if we’re able to double our conversion rate through rigorous landing page split testing, we would be cutting our CPA in half again:
CPA => ($100 / 200) / (20 / 200) = $5 CPA
In this example, our conversion rate went from 5% to 10% and our CPC stays at $0.50.
Let’s take a look at one more example. Let’s say we were able to find a cheaper acquisition source and our ad spend was only $50 for 200 clicks, meaning our CPC has been cut in half again (now $0.25 CPC). Here’s how that formula would look:
CPA => ($50 / 200) / (20 / 200) = $2.50 CPA
As you can see, all the metrics are intertwined and impact each other. Figure out where your formula is underperforming and focus on improving those weak points – whether your CPC is too high or your conversion rate is too low.
What about LTV?
What we haven’t discussed is how LTV affects our numbers. LTV provides a ceiling for acquisition cost. By improving LTV, you have more flexibility with how much you can pay for acquisitions. To keep things simple, the following examples have all per-customer business expenses built in to the LTV calculations:
-
If our LTV is $20, our CPA ceiling is $20 (except in special cases, as outlined in the example below). The maximum we are willing to pay for an acquisition is $20, therefore we are breaking even on them.
-
If we are in a phase of our business where growth is more important than profitability, we may be willing to pay a CPA that is higher than our LTV. In this case we are either playing the land-grab game with competitors or we assume we will be able to increase the LTV of our customers over time.
-
We should try to get our CPA as low as possible so we actually profit on our acquisitions. It is best to shoot for at least 100% ROI on ad spend. This means if our LTV is $20, we should aim for a $10 CPA.
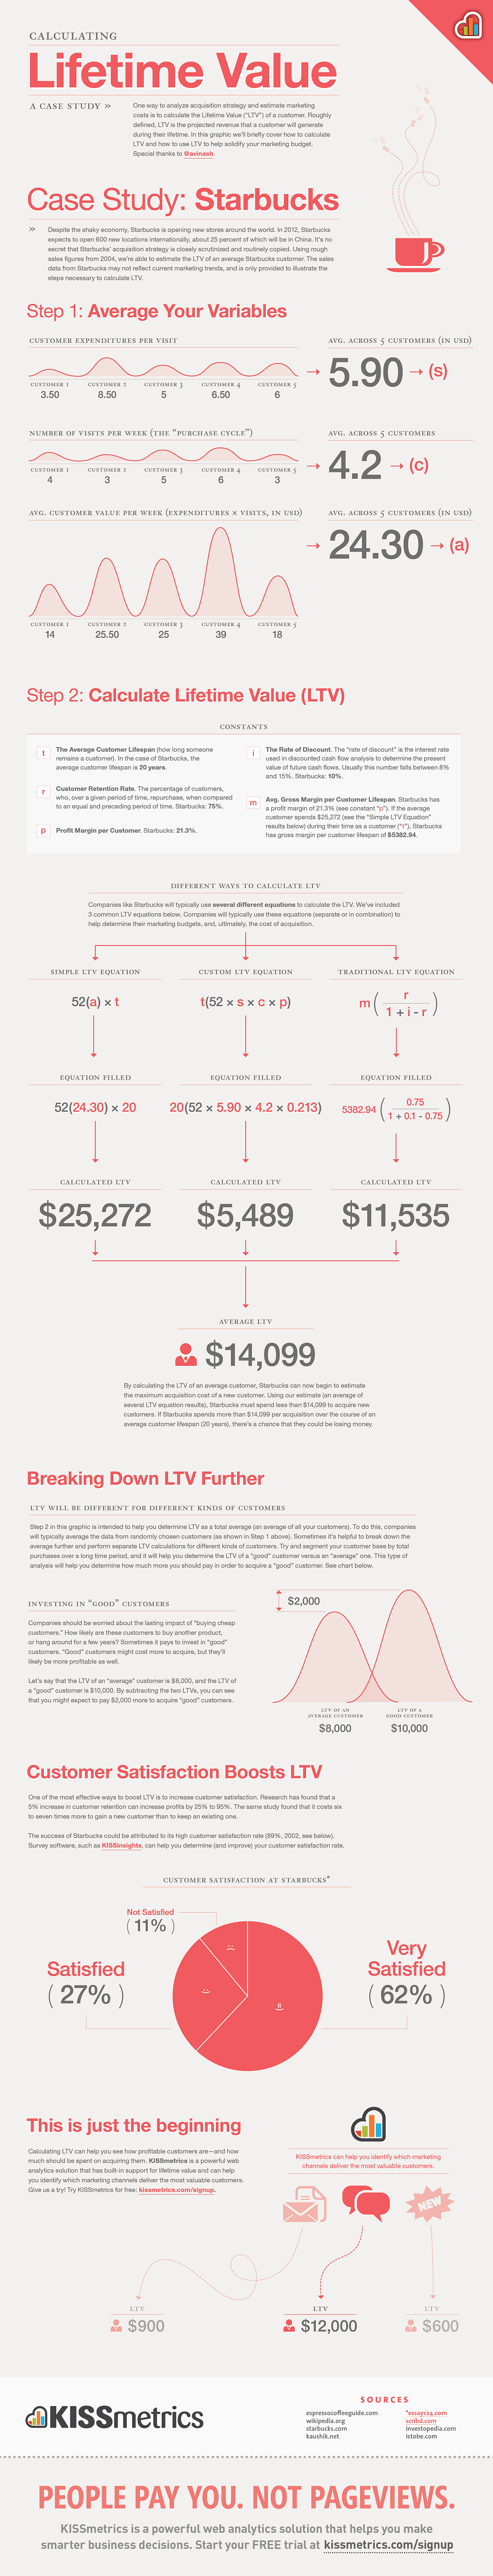
LTV calculation is difficult, especially when a startup hasn’t been around very long. However, in order to properly set goals for distribution, we must have an LTV ceiling. The simplest version of the LTV formula is:
LTV = Expected Life (time) x ARPU x Margin
The Kissmetrics blog posted a great resource for understanding how to calculate LTV
Improving LTV
As mentioned previously, increasing our LTV allows us to spend more money on each customer acquisition. Having a higher CPA while still remaining profitable means the ability to have greater scale in our acquisition efforts. Since we are able to pay more per acquisition, we can outbid our competition for ads and even try more expensive acquisition channels. More options = more scale!

Here are some general strategies to improve our LTV:
-
Lower our per customer expenses – this one is pretty obvious. If we are able to lower our cost to service each customer then each customer has a higher value to our business.
-
Improve retention – Increasing our retention rate extends the average life of each of our customers, meaning they will be paying us more over time. Here are some easy tactics to improve our customer retention:
-
Drip/trigger emails – use re-engagement emails to upsell our users
-
-
Upsell – Upselling our users with a targeted sales approach will increase the average value of each customer.
-
Segment users – to maximize our LTV, we need to fully understand the different types of customers we have. We should be segmenting our users and upselling them accordingly.
Conclusion
Acronyms are our friend! Just kidding, but they are necessary since there are so many different terms needed to describe our metrics. Understanding how each of these metrics affects each other is critical to understanding how to improve them and ultimately acquiring users profitably (CPA < LTV). Focus on the weak points in your formula for the easiest way to bring down your CPA.
500 Global Team

